
 Facebook
 X
 Pinterest
 Copy Link

The Cook County market update for October comes down to one word: shift. Prices are still up from a year ago, but closings fell 20%, homes closed at 99.7% of list, and supply has climbed three straight months. That means more leverage for buyers, less room for sellers, and a 7.24% mortgage rate sitting on top of everybody.
Let’s break it down. No fluff, just what the numbers mean for your next move.
October Cook County Market Update: The Numbers
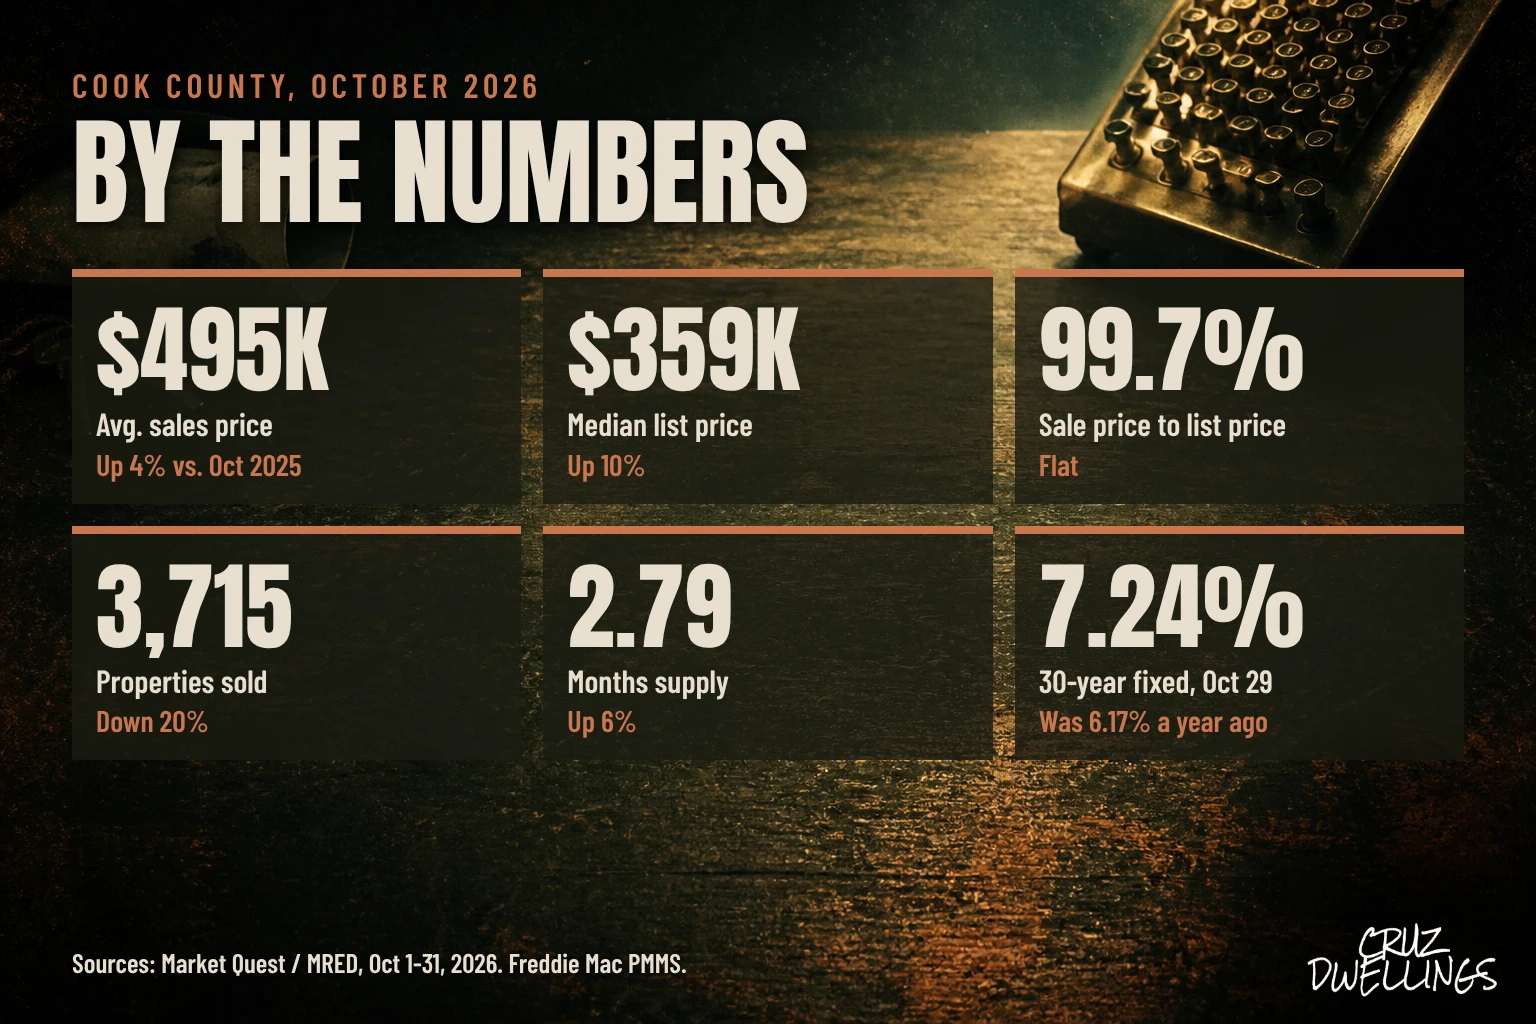
Here’s the snapshot for October 1 through 31, compared to October 2025. It covers single family, townhomes, multi-family and condos, and it comes from Market Quest / MRED.
- Average sales price: $495K, up 4%
- Median list price: $359K, up 10%
- Sale price to list price: 99.7%, flat
- Properties sold: 3,715, down 20%
- Months supply of inventory: 2.79, up 6%
Be real about the headline here. Prices being up 4% is not the story. Volume is. Twenty percent fewer closings than a year ago is a big drop, and it tells you a lot of buyers have stepped back even while prices hold.
Prices being up 4% is not the story. Volume is.
The 3-Month Trend: Everything Moved Toward Buyers
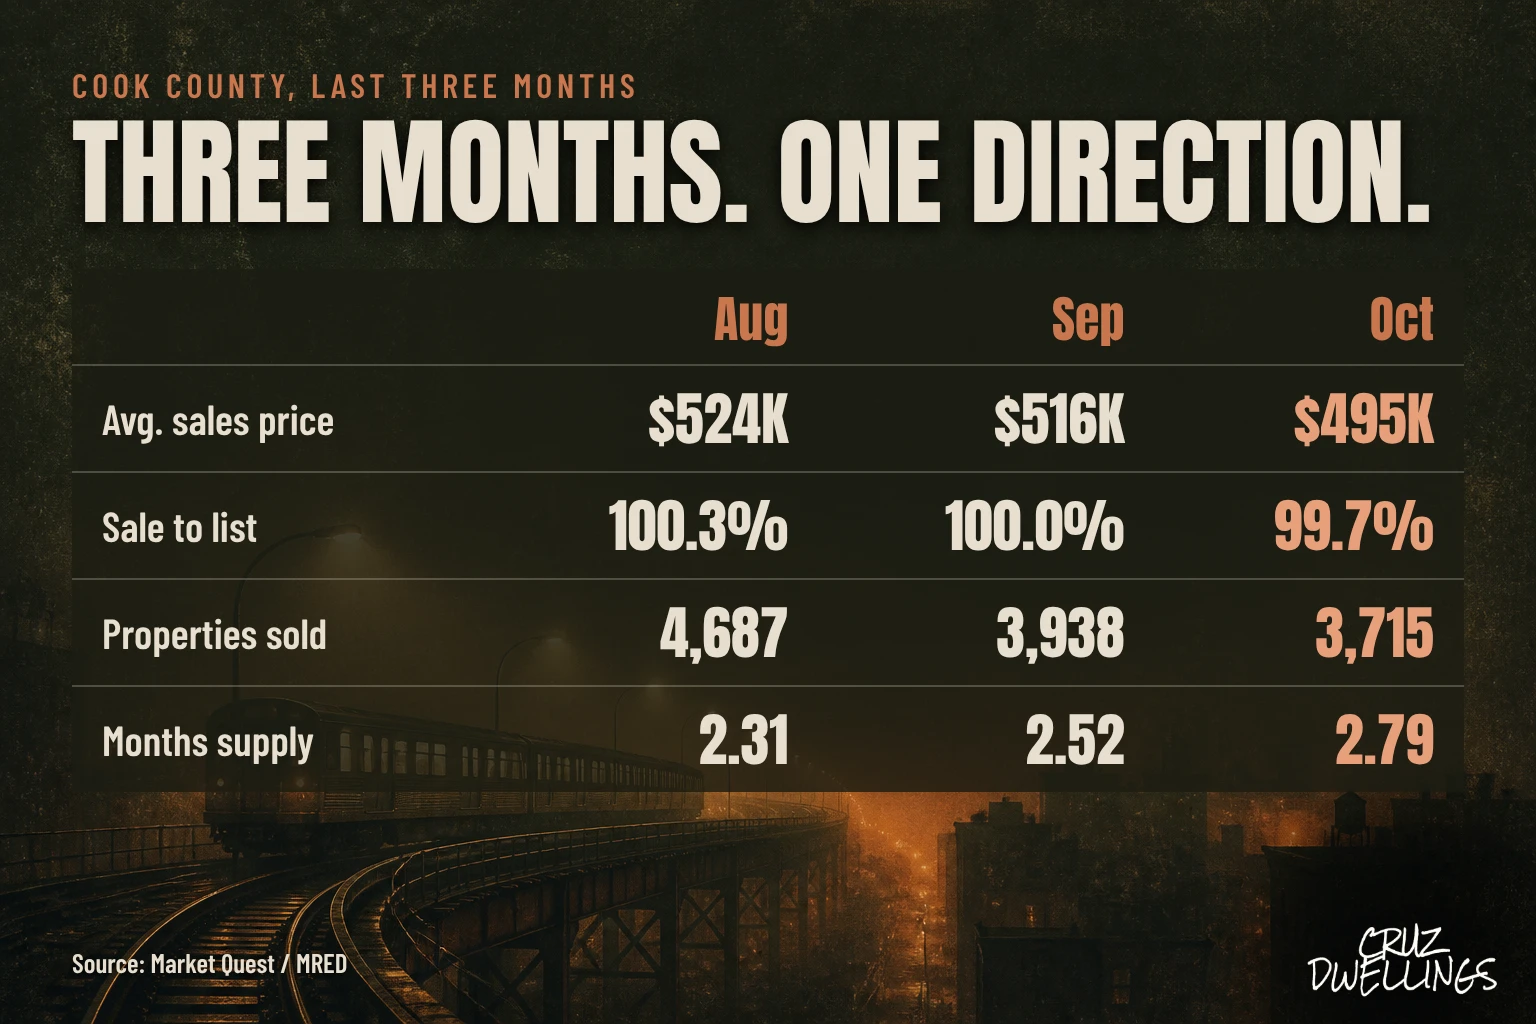
| Cook County | Aug | Sep | Oct |
|---|---|---|---|
| Avg. sales price | $524K | $516K | $495K |
| Sale price / list price | 100.3% | 100.0% | 99.7% |
| Properties sold | 4,687 | 3,938 | 3,715 |
| Months supply | 2.31 | 2.52 | 2.79 |
Four metrics, three months, same direction. The average price came down from $524K to $495K. The sale-to-list ratio slid under 100%. Closings fell. Supply climbed about a quarter of a month, every month.
Back in August, the average home closed above list at 100.3%. In October it closed at 99.7%. On a $400,000 list price, that’s $398,800. Not a fire sale. But it’s a different fight than paying over ask.
Now zoom out. In my April update, supply was 1.89 months. It’s 2.79 now. Some of the recent sales drop is seasonal, and I won’t pretend otherwise. But the direction is consistent.
What This Means for Buyers

You have more room to negotiate
More supply and fewer closings put you in a better spot than you were in August. NAR’s chief economist Lawrence Yun said nationally that higher inventory and longer days on market give buyers “improved negotiating power.”
That doesn’t mean lowball everything. 99.7% is still close to list, and Cook County is tight compared to the rest of the country. It means you can ask. A credit, a repair, a timeline that works for you. And once you’re in contract, know what happens after your offer gets accepted, because that’s where a lot of deals get won or lost.
Your payment is the real limit
Know your number before you fall in love with a house. Your debt-to-income ratio and your credit score shape what a lender will do, and at these rates a small difference hits the monthly payment. If cash is what’s holding you up, read my breakdown of IHDA down payment assistance and confirm the current rules with a participating lender.
What This Means for Sellers

Summer pricing is over
The median list price is up 10% from a year ago. The average sale price is up 4%. Those are two different measures, so it’s not a perfect comparison, but it’s a loud signal: asking is running ahead of what’s closing.
Your number has to come from today’s comps, not summer’s. The average sale went from $524K in August to $495K in October. If you’re anchored to a July price, you’re going to sit. Yun’s national message was the same: sellers “need to be realistic about local market conditions.”
Your number has to come from today’s comps, not summer’s.
You still hold real cards
2.79 months of supply is still tight, and homes are closing right around list. Price it right on day one and you’re in a good position. Price it wrong and you end up chasing the market down. I covered the big ones in my seller mistakes post. And if you’re moving and buying your next place too, here’s how to buy and sell at the same time.
Mortgage Rates: The Heel in This Storyline
Freddie Mac’s 30-year fixed averaged 7.24% as of October 29, down from 7.32% the week before and the lowest level of the month. That’s the good news. The bad news is it was 6.17% a year ago, and NAR puts the September average at 6.86%.
Here’s what that does to a real payment on a $400,000 30-year loan, principal and interest only:
- At 6.17%: about $2,442 a month
- At 7.24%: about $2,726 a month
- The difference: about $284 a month, before taxes and insurance
That payment jump explains the closing drop better than prices do. Yun said it directly: rate increases mean “fewer buyers can qualify.” I’m not going to tell you where rates go next, because nobody knows. Run your real payment at the real rate you’re quoted, and make your decision on that.
Cook County vs. the Rest of the Country

NAR’s latest national numbers cover September, released October 13. Existing-home sales ran at a 3.99 million annual pace, up 1.5% from August and down 2.2% from a year ago. The national median price was $417,500, up 1.3%, the 39th straight month of year-over-year gains. In the Midwest, the median hit $329,600, up 3.1%, with sales flat from August and down 2.1% from a year ago.
National supply sits at 4.8 months. Cook County is at 2.79. So even after three months of loosening, this county is much tighter than the country. But closings here fell 20% year over year, compared to 2.2% nationally. Different months, so it’s not a perfect match, but local buyers appear to be pulling back harder.
Quick Answers
Is Cook County a buyer’s market or a seller’s market right now?
On supply, it still leans seller at 2.79 months, versus 4.8 nationally. But every key number has moved toward buyers for three straight months.
Are Cook County home prices dropping?
Year over year, no. The average sale price is $495K, up 4%. Month to month, it has come down from $524K in August.
Can I offer under list price in Cook County?
You can. Homes averaged 99.7% of list in October. Whether it works depends on that specific home, its comps and how long it’s been sitting.
Should I wait for rates to drop?
I can’t promise you where rates go. What you can do is run your payment at today’s quote, see if it works, and decide from there.
Buying in Cook County and want your real number? Grab my free First-Time Homebuyer Planner and start on page 23, Shop three lenders, so you’re comparing real quotes instead of guessing. Text me at (773) 914-4299. Real answers, no pressure.
Sources: Market Quest / MRED Cook County snapshots, August through October 2026; Freddie Mac Primary Mortgage Market Survey; National Association of REALTORS September 2026 existing-home sales report. Figures checked November 5, 2026.
This article is general education, not legal, tax, lending or financial advice, and is not an offer of credit or a pre-approval. Programs and rules change. Confirm details with your lender, attorney and tax professional. Christian Cruz, REALTOR®, Coldwell Banker Realty, Lic #475.212761. Equal Housing Opportunity. Affiliated real estate agents are independent contractor sales associates, not employees of Coldwell Banker.



Affiliated real estate agents are independent contractor sales associates, not employees. ©2026 Coldwell Banker. All Rights Reserved. Coldwell Banker and the Coldwell Banker logo are trademarks of Coldwell Banker Real Estate LLC. The Coldwell Banker® System is comprised of company owned offices which are owned by a subsidiary of Anywhere Advisors LLC and franchised offices which are independently owned and operated. Equal Housing Opportunity.
